Take any three points in the universe, that are not on the same line, and they form a triangle. We also have seen how these three points can generate the 2-D Euclidean space where the triangle lives. Oh, the things we can do with a humble triangle.
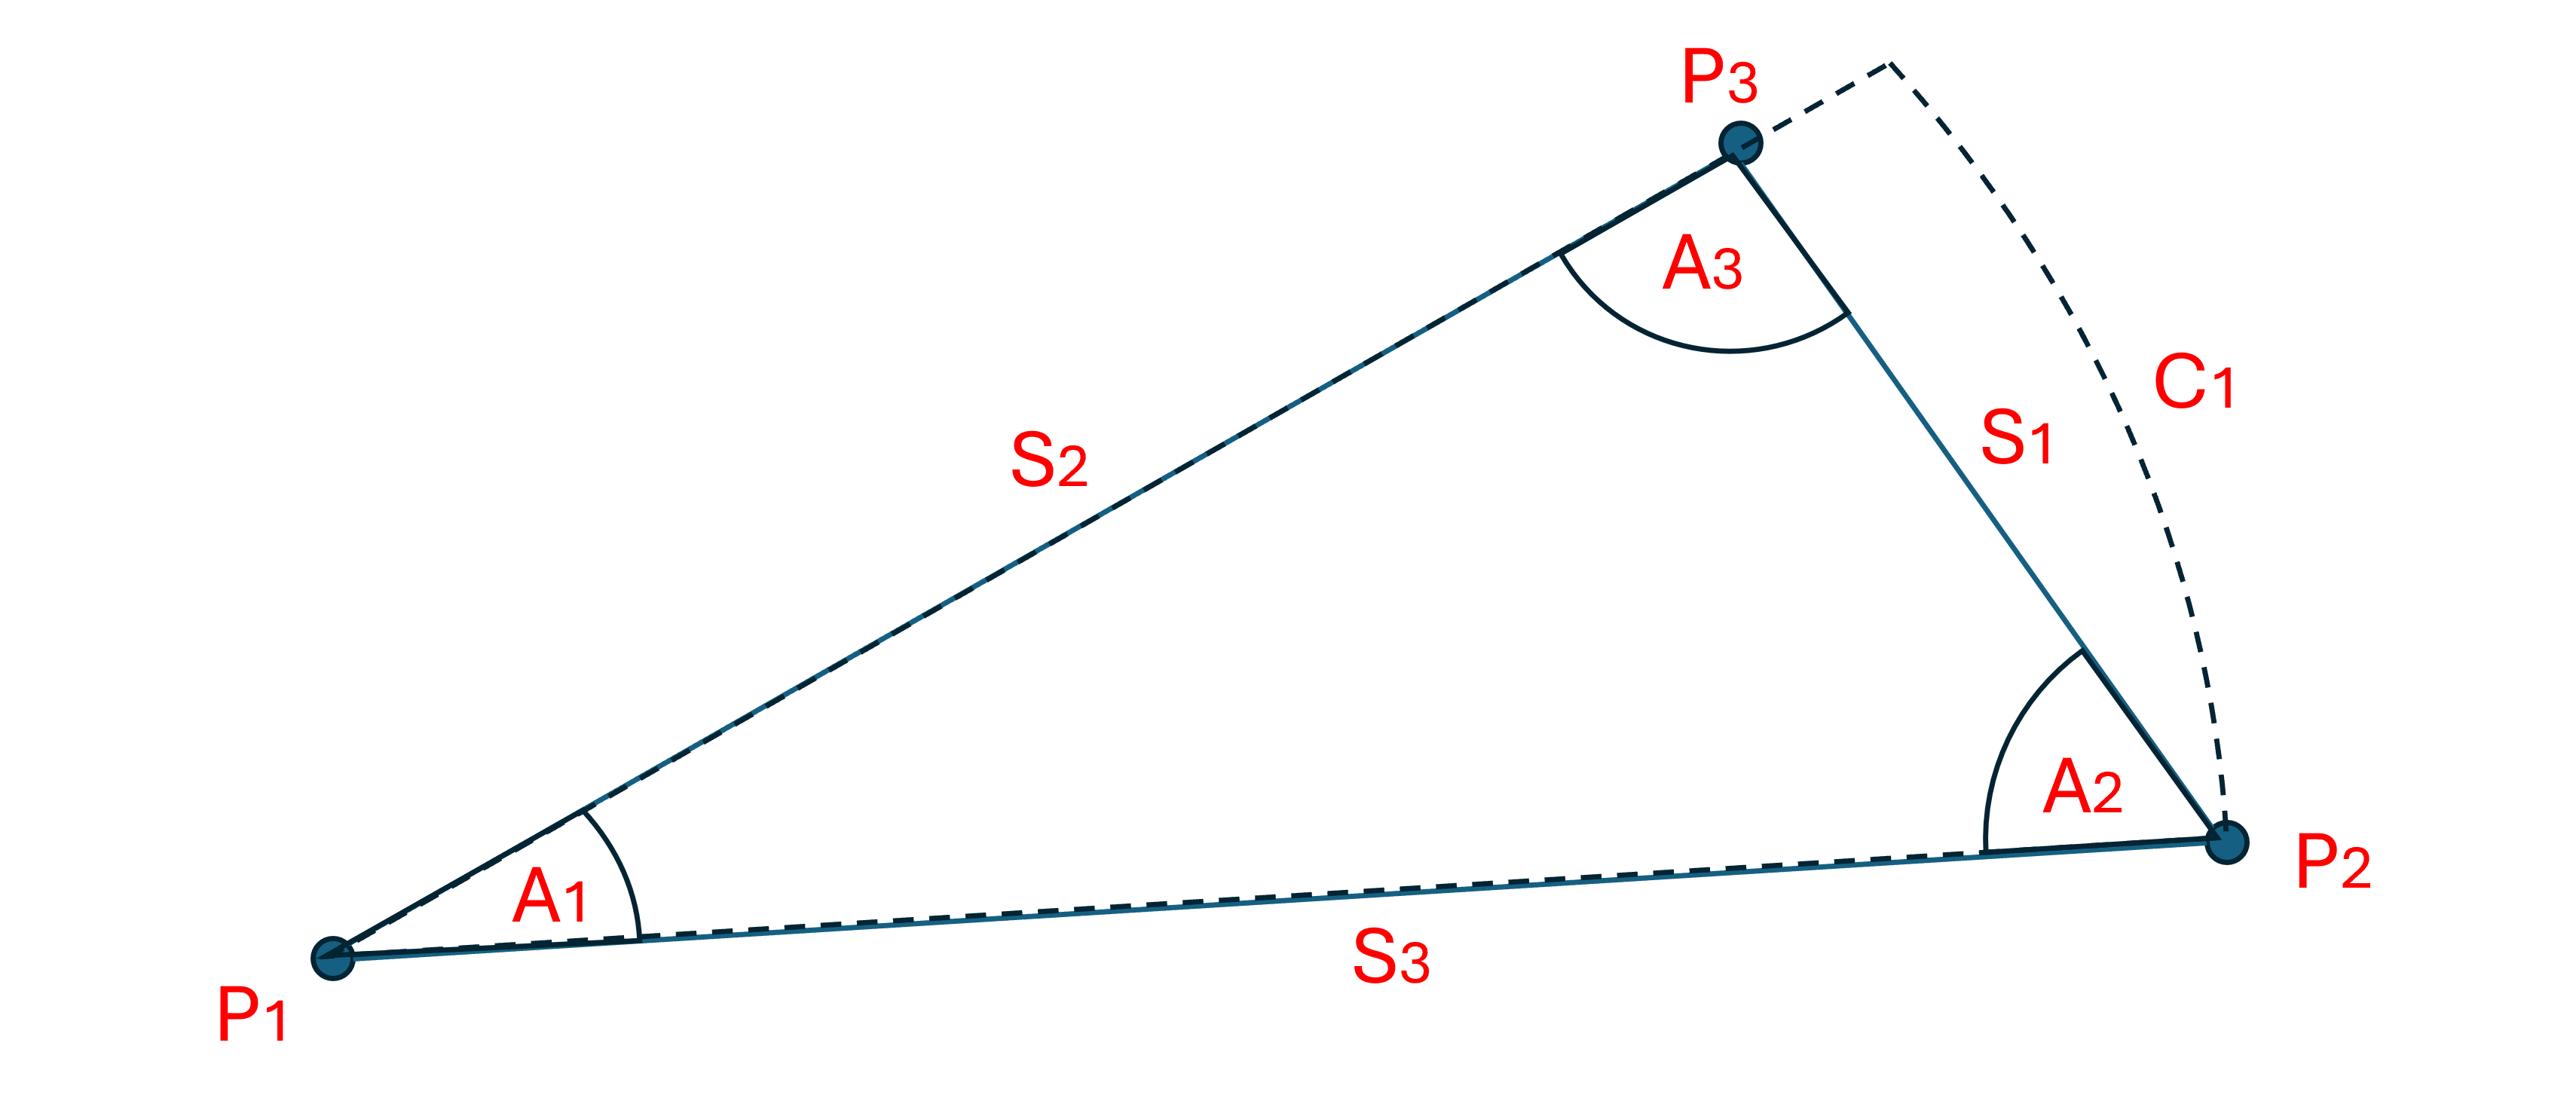
We can start by labeling its parts. The points are connected by the three line segments called sides. Let’s call the point that is farthest away from the other two points, P1. This is also the point that connects the two longest sides. We can label the point on the other side of the longest side P2, and the remaining point P3.
It makes sense to put the label S1 for the side opposite the point P1, and the same for S2, and S3. The side S3 then connects the points P1 and P2, and is the longest side, simply because we chose P1 and P2 to be on the longest side. And so the side S2 is the second longest side, and S1 the shortest side with the same reasoning. In math language S1 is less than or equal to S2 and S2 is less than or equal to S3 : S1 <= S2 <= S3.
We simply chose the labels so this is true. The way you choose to label things makes things easy to remember and deal with. We can also choose to label the angle A1 to be next to the point P1, A2 to be next to P2, and A3 to be next to P3.
Angles are measured as percentages of the “piece of pie” inside the angle in proportion to the whole pie. You can find the angular percentage of A1 by taking the length of the circular arc C1 (in the diagram) and dividing it by the circumference of the whole circle, 2*π*S3.
The angle in degrees is found by multiplying this percentage, C1/(2*π*S3), by 360 degrees in the whole circle:
A1 = 360 * C1/(2*π*S3).
Mathematicians chose 360 “degrees” in a full circle because it can be divided equally into 2, 3, 4, 5, 6, 8, 9, 10, 12, 15, 18, 20, 24, 30, 36, 40, 45, 60, 72, 90, 120, 180, and 360 pieces.
Another way to measure angles is to use “radians”, chosen so that 2*π radians are in a full circle. Thus in radians,
A1 = 2*π * C1/(2*π*S3) = C1/S3
Which is a more natural measure for angles based on the arc lengths of a circle.
If you really want to learn geometry, trigonometry, or build virtual worlds, then understanding the concepts we are about to explore gives you great power.
Suppose, for example, you want to find a cartesian grid that will map where these points are in space, then choosing good reference points and directions can make all the difference.
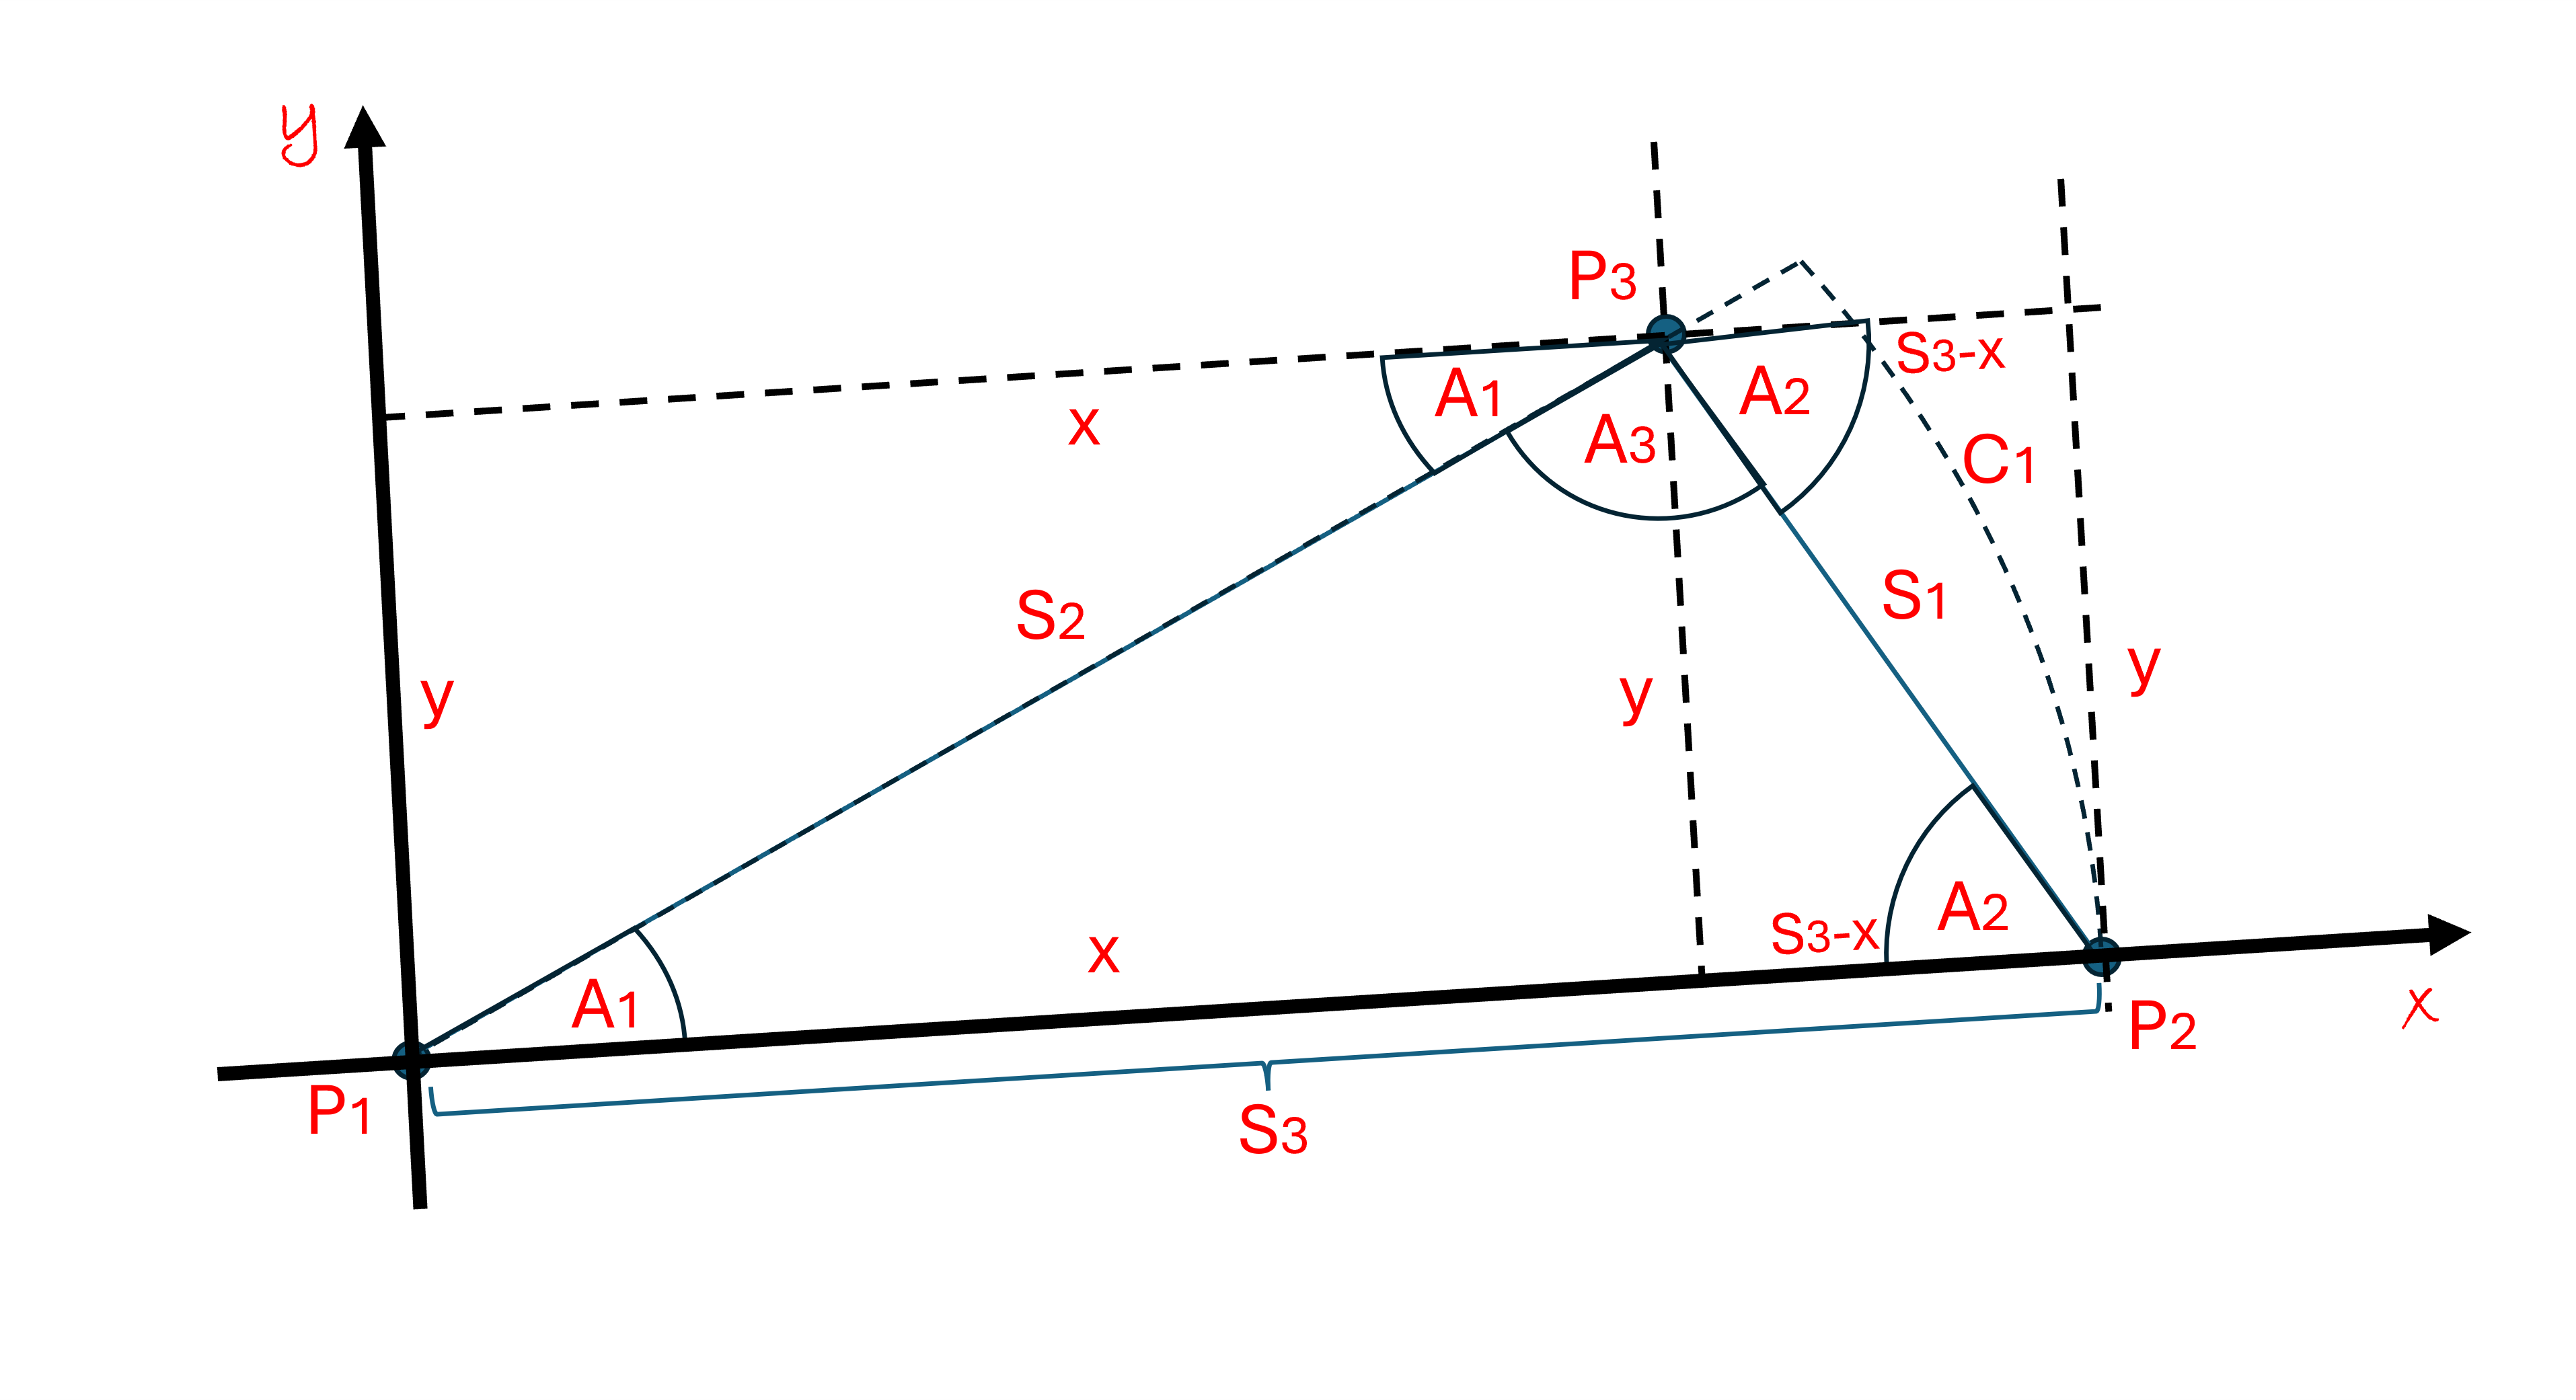
If you choose P1 to be the reference point (the origin), then choose the “x” direction to point directly along the S3 side toward point P2, and pick the perpendicular “y” direction so that P3 is on the positive side. Then you placed this universal triangle on a grid as shown on the diagram above. P3 is the only point that does not lie on an axis. The distance of P3 from the y axis is labeled “x” and the distance of P3 from the x axis is labeled “y”, as shown in the diagram.
This breaks the triangle up into two rectangular regions, as shown by the dashed lines in the diagram. The area of the left rectangle is x * y, and the area of the right one is (S3-x) * y. If you add these two areas together you get a total area of S3 * y. It is easy to see that the area of the triangle, by symmetry, is exactly half of the area of the two rectangles, so:
Area of triangle = ½ * S3 * y.
We can easily see this from the diagram. The left rectangle is made with two exact copies of the x, y, S2 triangle so the angle, A1, is the same on the top and bottom half of the first rectangle. The same goes for the A2 angle in the (S3-x), y, S1 triangles on the right. Adding the angles together on the top junction of the rectangle, it is easy to see that:
A1 + A2 + A3 = 180 degrees (universally true for all triangles).
From the diagram and by the Pythagorean theorem we can also see that:
S22 = x2 + y2
S12 = (S3-x)2 + y2
= S32 – 2*S3*x + x2 + y2 (and x2 + y2 = S22)
= S32 + S22 – 2*S3*x (known as the law of cosines)
And when S1 and S2 are the same length then:
S22 = S12
S22 = S32 + S22 – 2*S3*x
Thus by simple algebra
S32 = 2*S3*x
x = ½ * S3
And so we see that when x is halfway between P1 and P2, then the sides S1 and S2 must be equal in length. We can also see that if S2 is greater than S1 then x must be greater than ½ * S3, on the right-hand side of the midpoint.
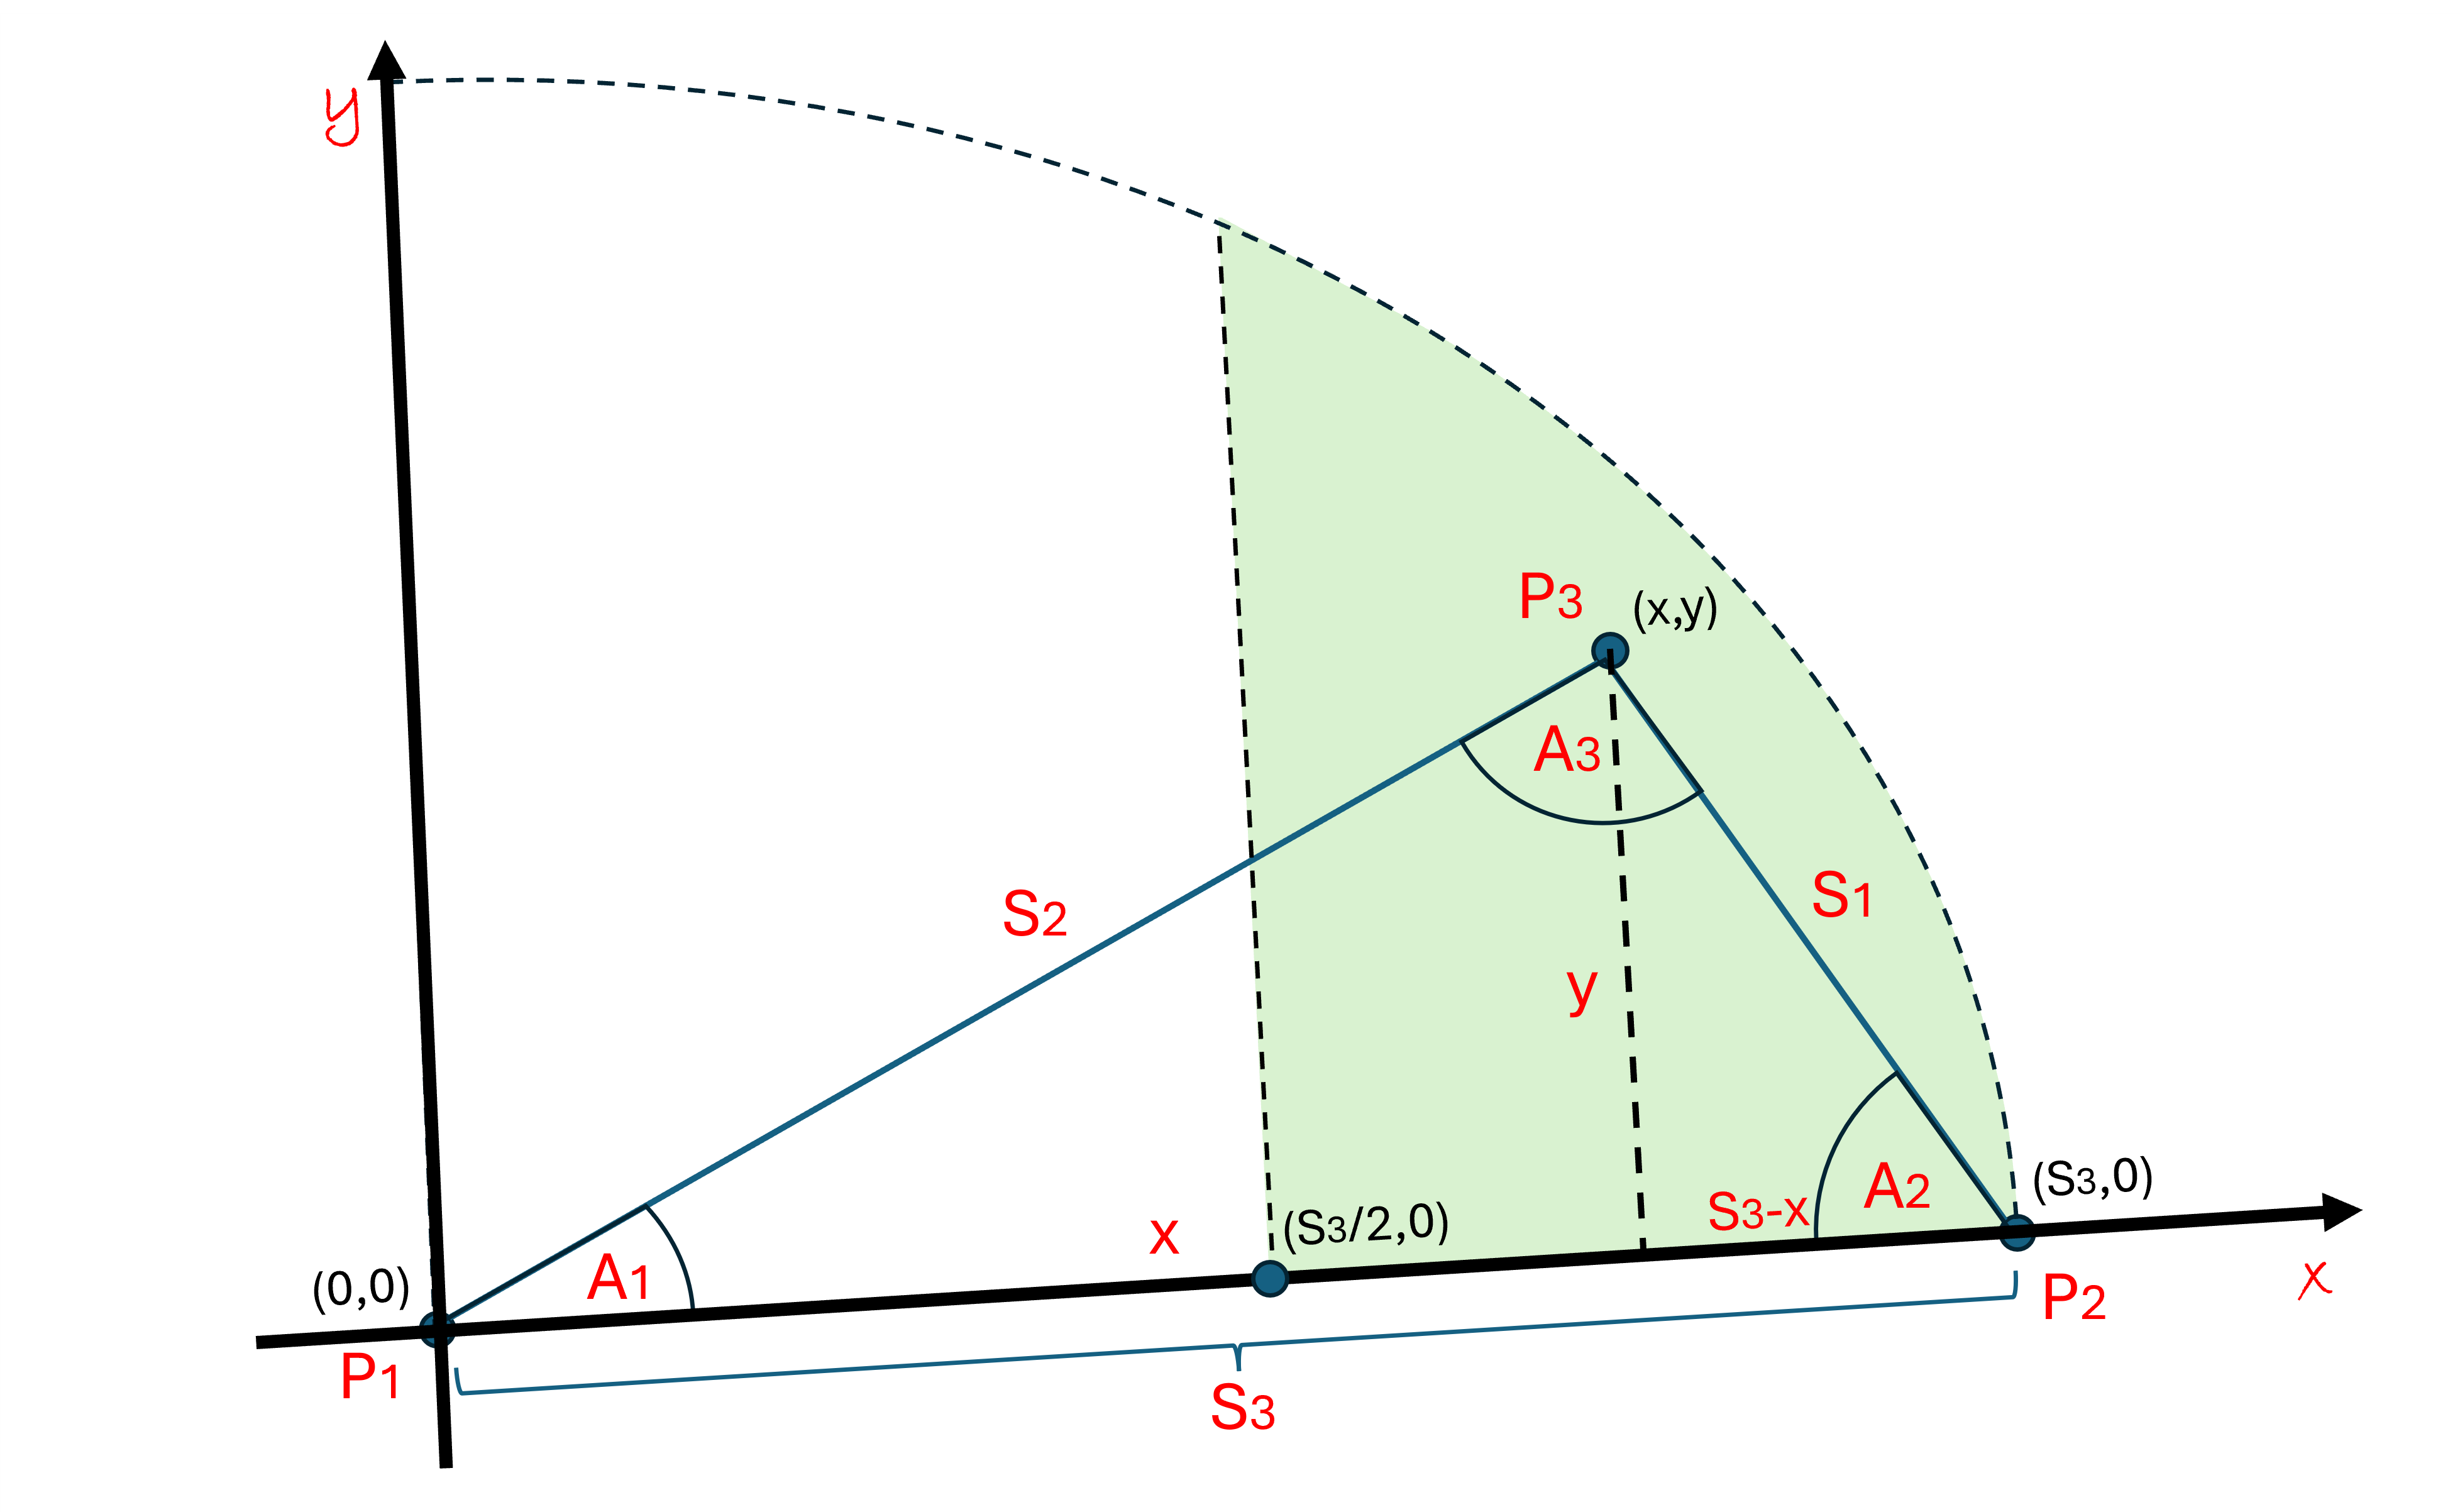
We now can see that there are some natural restrictions on where P3 can be in the above diagram, since S2 is greater than or equal to S1, then x >= ½ * S3, and since S2 is shorter than S3, P3 must be inside a circle of radius S3. Thus, P3 is restricted to be in the shaded region shown in the diagram. If P3 was outside this region, then S2 would be longer than S3 or shorter than S1 and we would need to re-label the points and sides accordingly and redraw our grid, then P3 would again be in the region.
We now can supply the Cartesian coordinates of the three points in this grid:
P1: (0,0)
P2: (S3,0)
P3: (x,y)
Note that this applies to all triangles in the universe, as long as we follow the labeling guidelines for the parts of the triangle and set up the grid like we have done here.
To work with the angles and find x and y, there are “trigonometric” functions on our calculators, Sin(Angle) and Cos(Angle), to find x and y from the angles, that are defined as follows:
Sin(A1) = y/S2 [or y = S2 * Sin(A1)]
Cos(A1) = x/S2 [or x = S2 * Cos(A1)]
We can also work with the angle A2 by looking at things from the P2 side:
Sin(A2) = y/S1 [or y = S1 * Sin(A2)]
Cos(A2) = (S3-x)/S1 [or x = S3 – S1 * Cos(A2)]
The angle A3 can be found because A1 + A2 + A3 = 180 degrees.
Notice that now you can find x and y if you know the angle A1 or A2, and the sides. You can fool around with this to find the missing information. For example, combining both expressions for x and y shown above, we get:
x = S2 * Cos(A1) = S3 – S1 * Cos(A2)
y = S2 * Sin(A1) = S1 * Sin(A2) (known as the law of sines)
These relations can be used to find x and y from the angles and sides, or the angles from x and y, or the sides from combinations of each. These are very useful in geometry. You can explore all the possibilities by taking a trigonometry course.
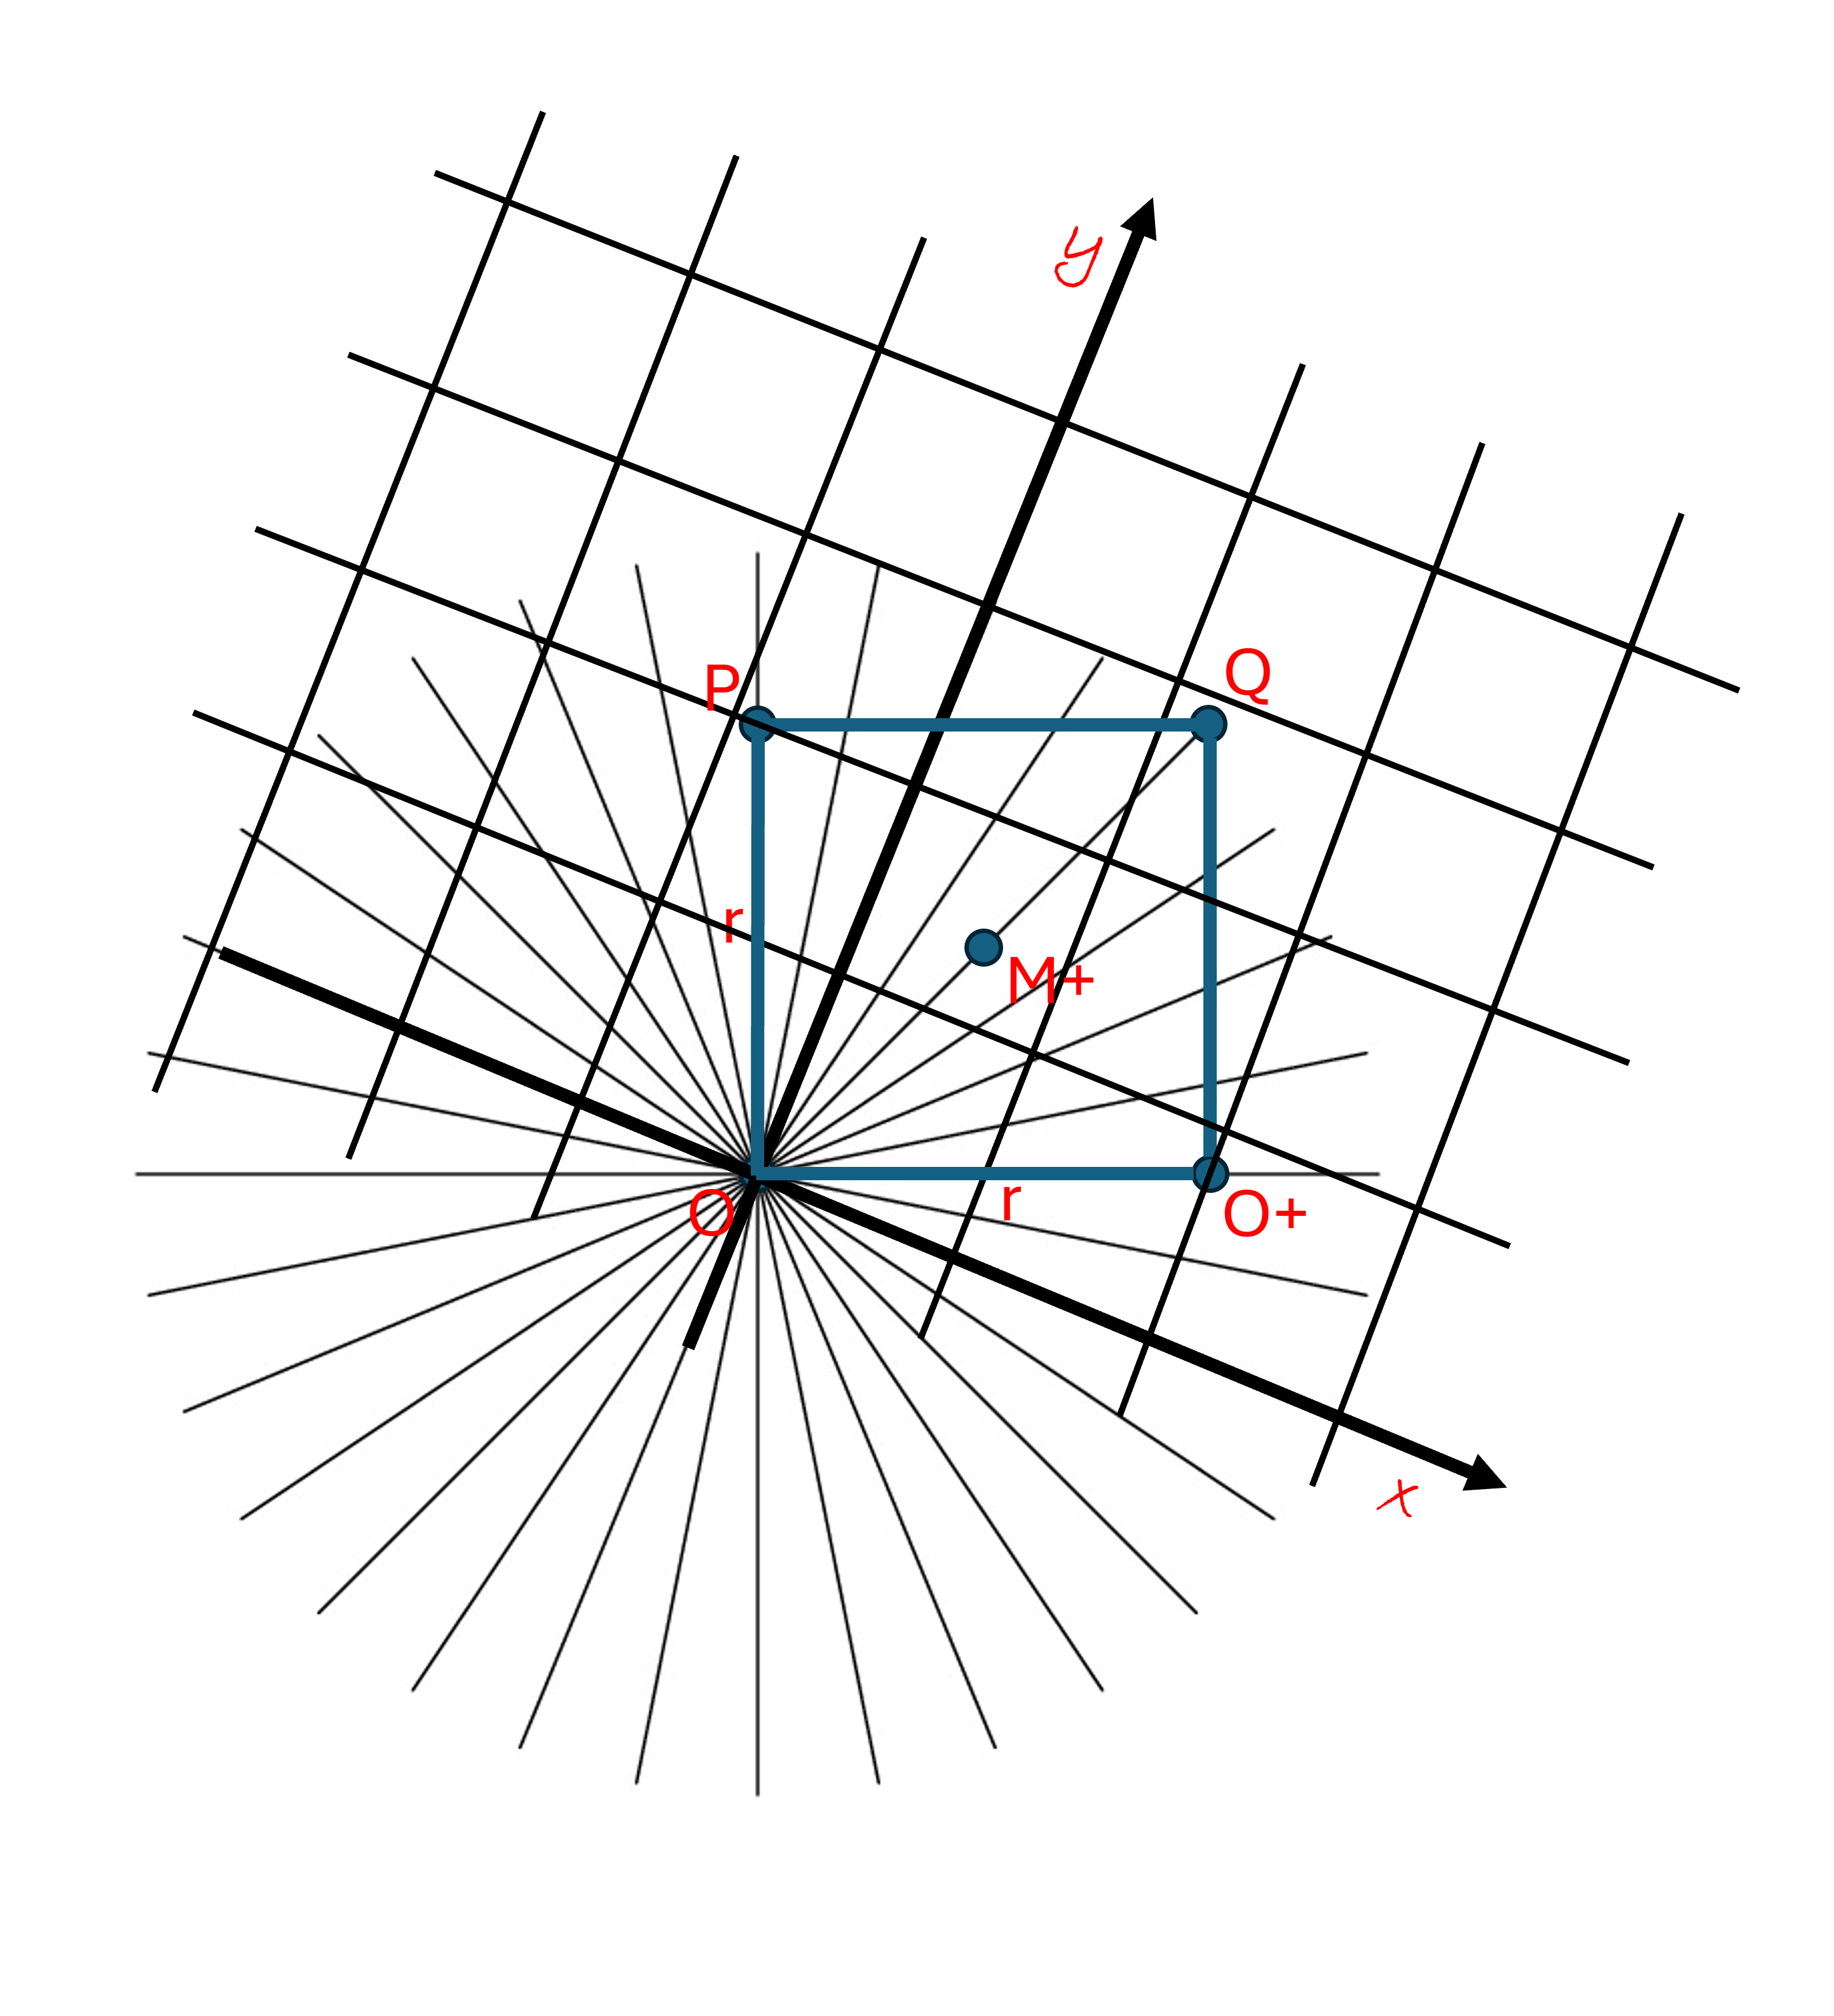
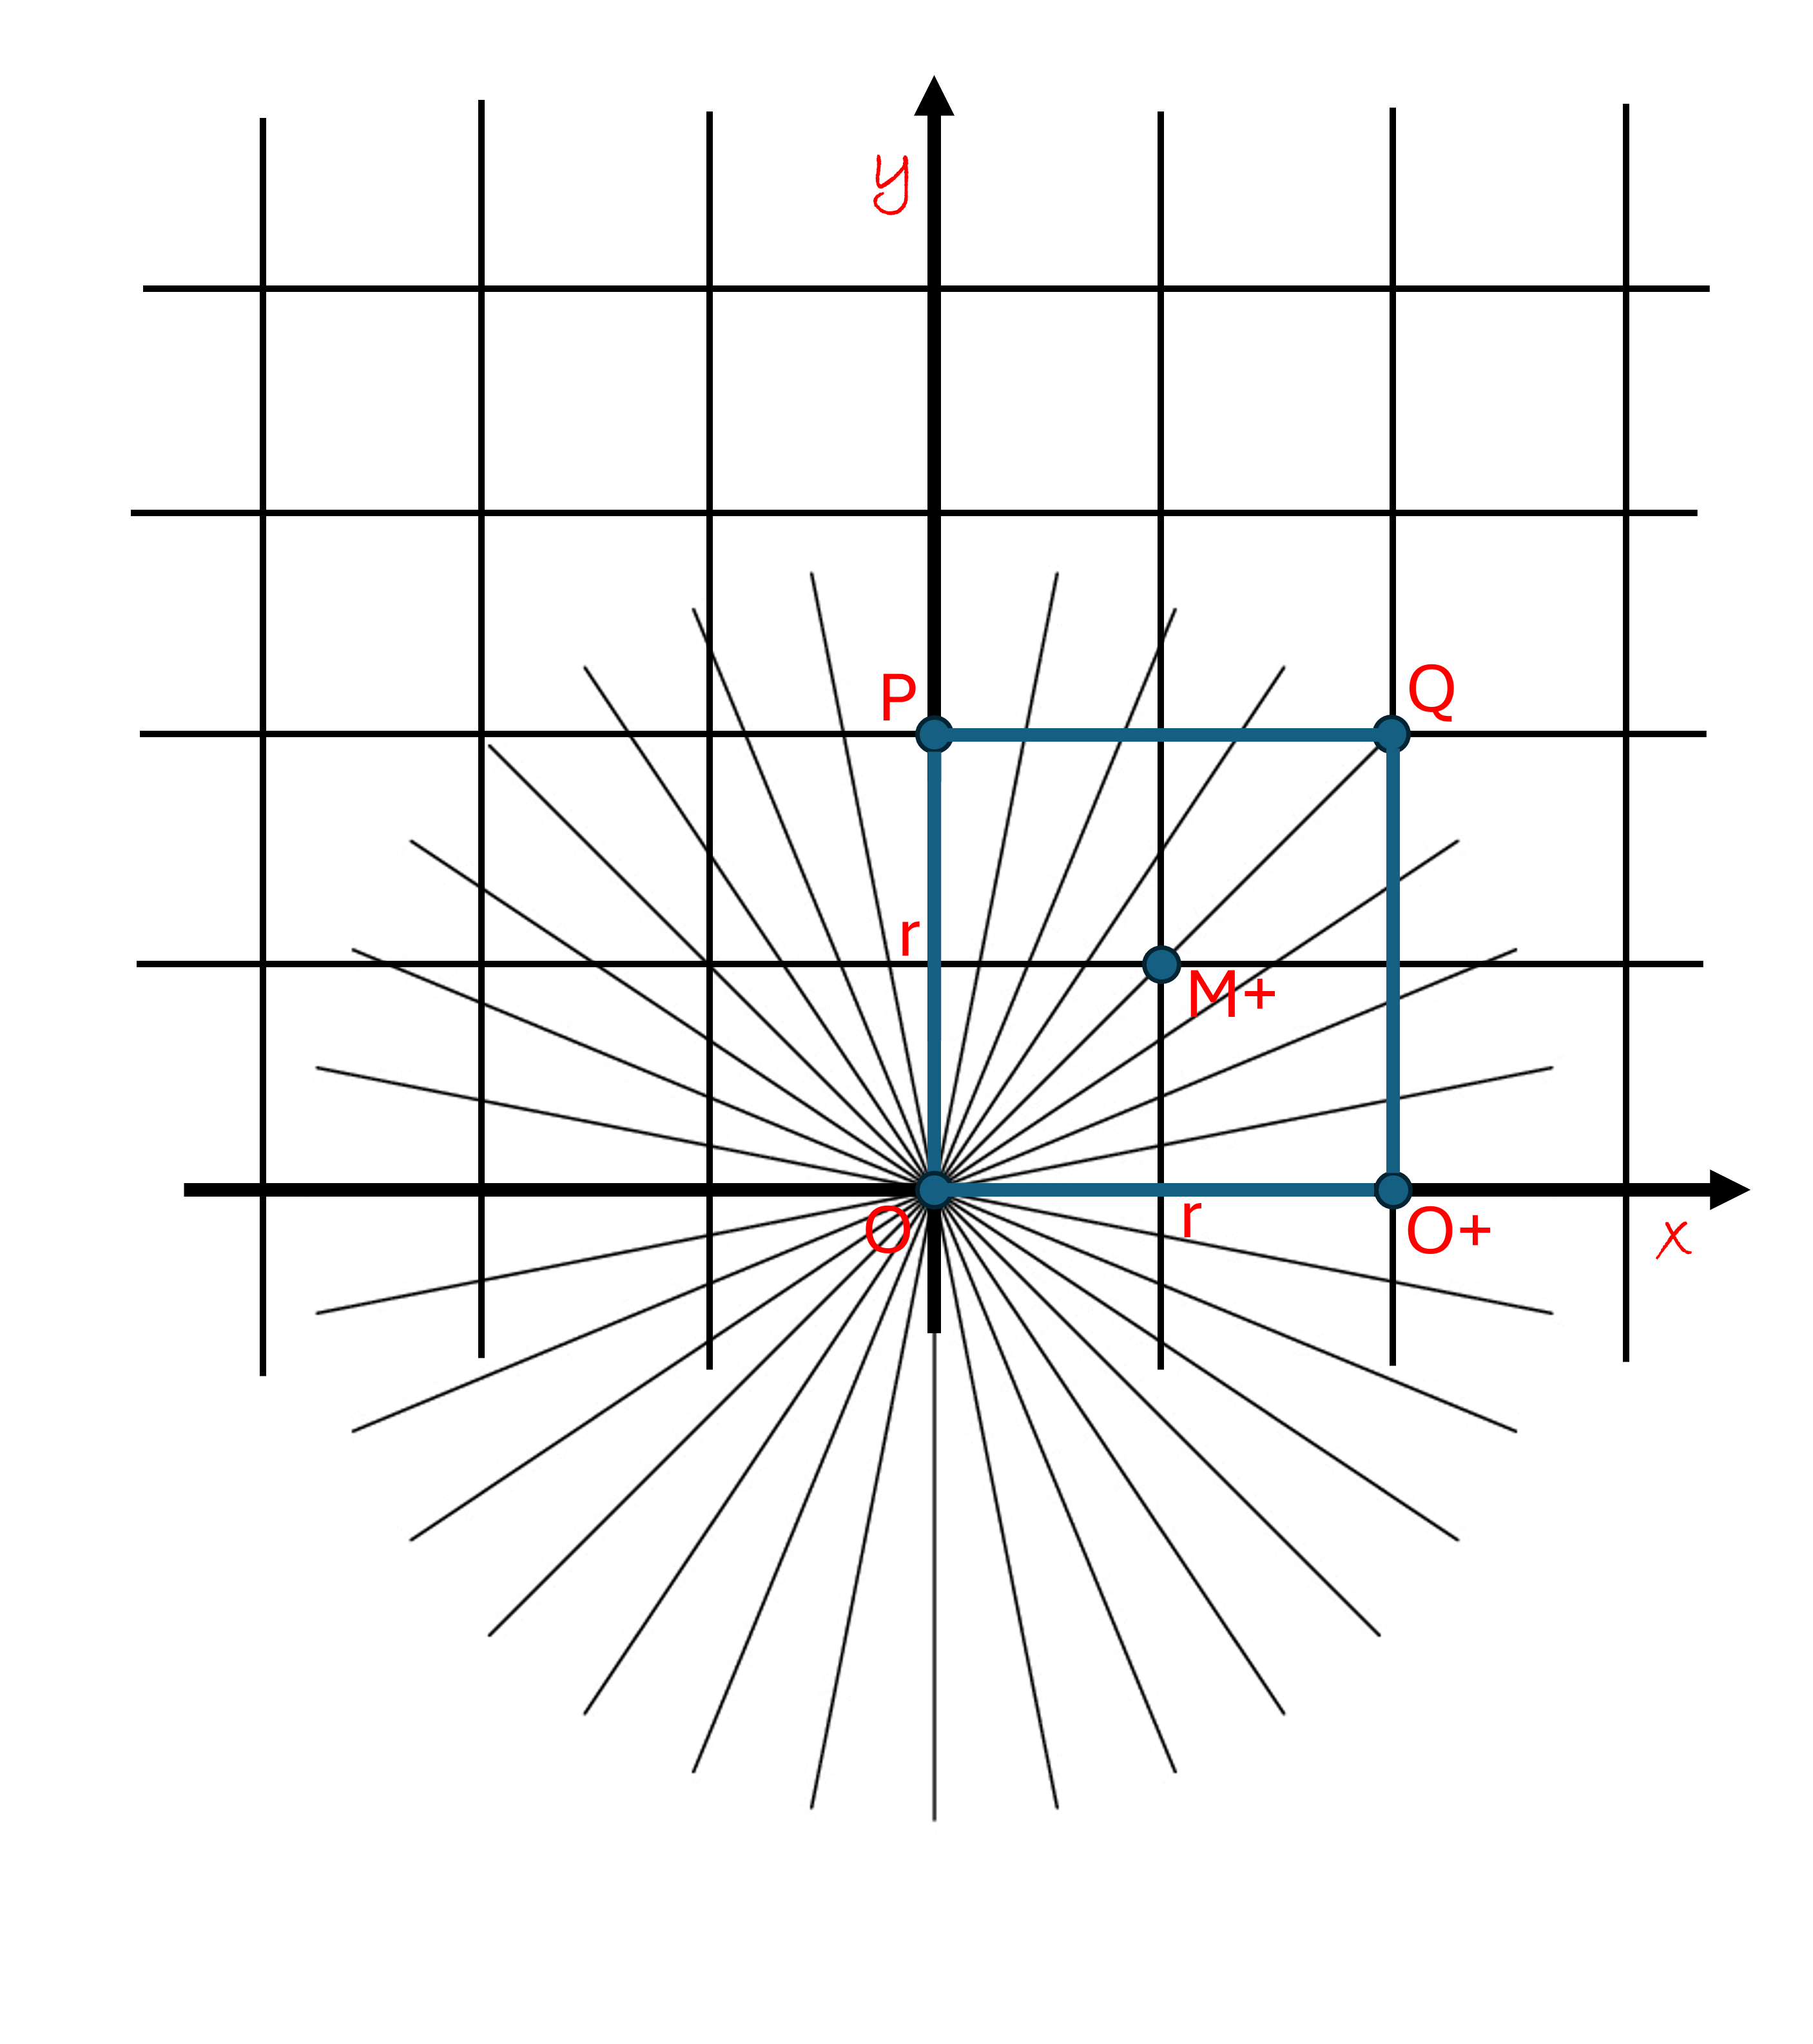
A surprising and revealing fact: you can use reflection symmetry to find a point that is the same distance away from all three points P1, P2, and P3. We call this the “center” point, C, and thus you can draw a circle that connects all three points. This means that if you randomly choose any 3 non-linear points, you can find a unique circle that connects these points.

To show this, we start by recalling the wonders of reflection symmetry. The midpoint of S3 between P1 and P2 is the same distance from both these end points. We can find all the points that are the same distance away from P1 and P2 by drawing a perpendicular line of reflection through the midpoint of S3. We saw that this is the line where x = ½ * S3. Any point on this vertical line is the same distance away from P1 as it is from P2. This is shown by the vertical dashed line in the diagram above. In the same fashion, the points that are the same distance from P1 as they are from P3 are found to be along the line of reflection that cuts the segment S2 in half, as is shown by the other dashed line on the diagram. These two midpoint lines of reflection from S3 and S2 meet at the “center point” C. And so, we see that this point C is the same distance “r” from P1, P2, and P3. We can draw a circle with center C and radius r that connects all three of these points, as shown in the diagram above.
Before we finish, let’s explore one other surprising universal fact about triangles. This comes from reflection symmetry of bisected angles that we have not covered yet. Any angle made from two lines can be cut in half, this forms a line of reflection symmetry. For example, in the diagram above, there is a dotted line that divides the angle A1 in half.
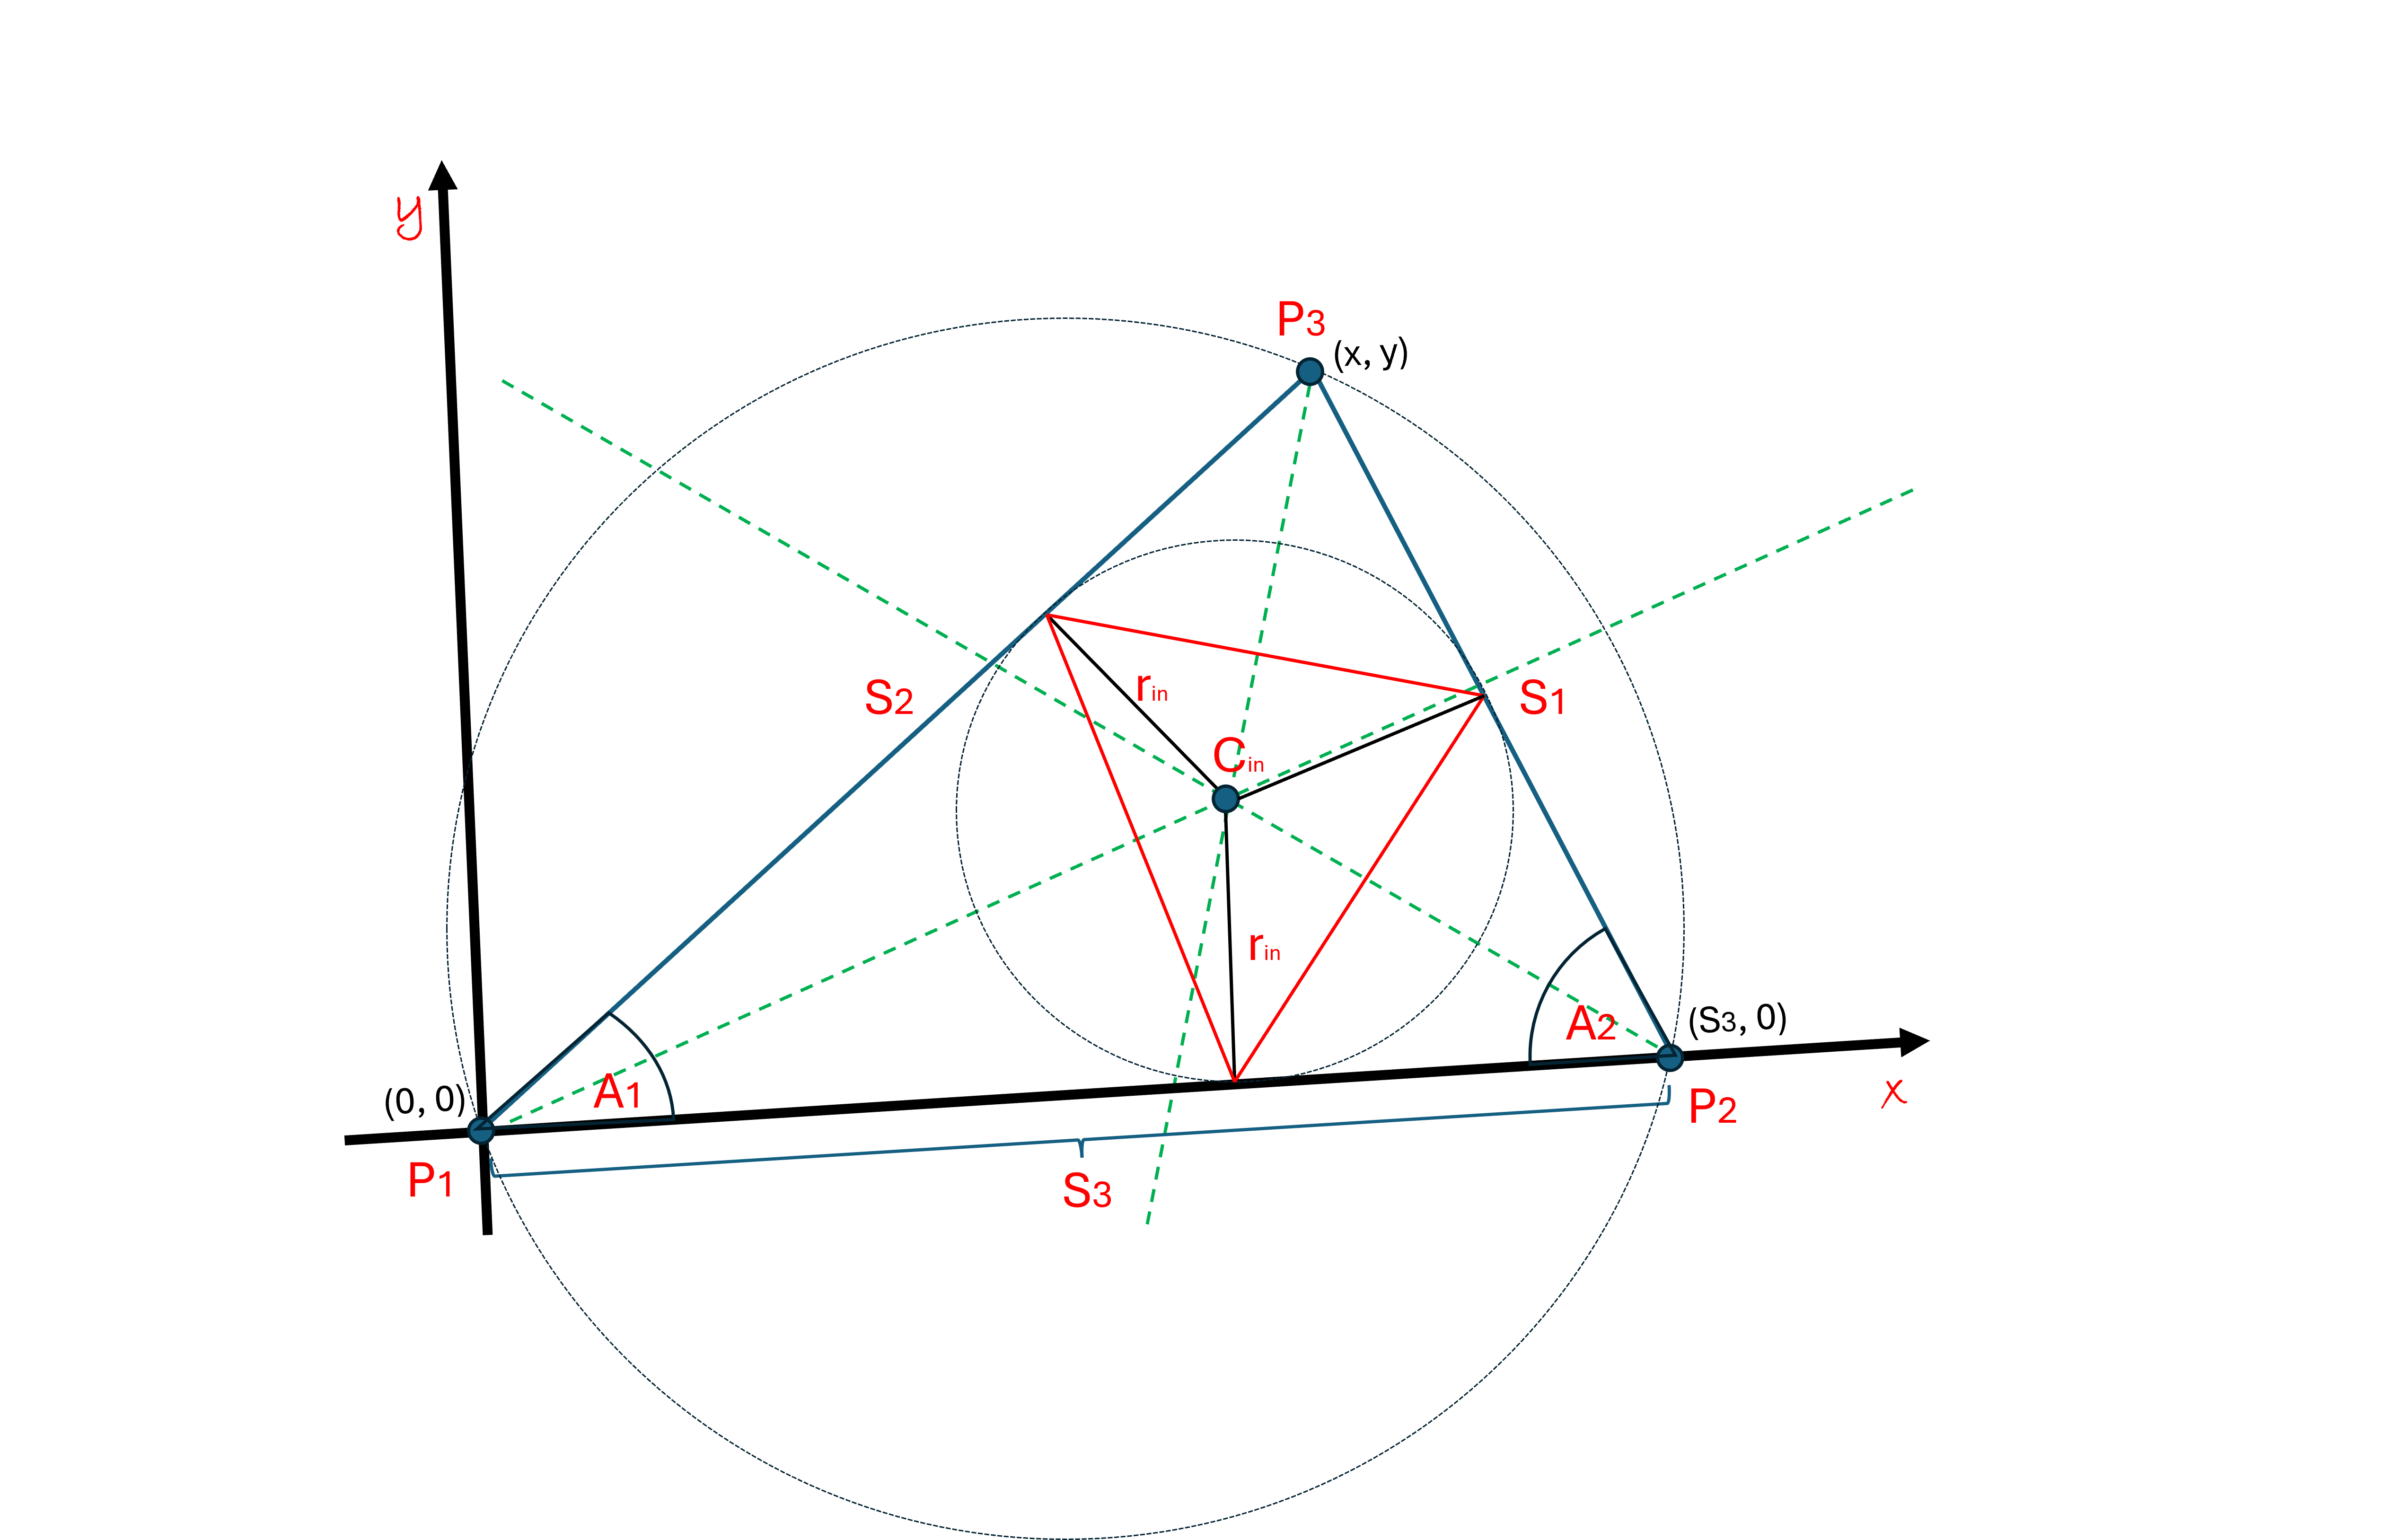
Through this line of reflection, you can reflect the line passing through P1 and P3 onto the line passing through P1 and P2. It might take a minute to see it. If I draw a circle with its center on this line, then the half-circle above the line can be reflected onto the half-circle below the line. This means that if the circle touches the line on the top, then by symmetry, it must touch the line on the bottom at exactly the same distance from P1.
Similarly, the point where the bisector lines of symmetry of A1 and A2 meet is the center of a circle that touches all three sides of the triangle. If you connect the three points where this circle touches all three sides with line segments, then you have a smaller triangle that breaks the triangle into three triangles that have two sides of equal length. The smaller triangle is inscribed inside a circle, and forms three other triangles with two equal sides (these are called isosceles triangles).
When you stare at the diagram, do you see the multiple symmetries here? You can divide any triangle into 6 isosceles triangles. Also note that the angle bisectors pass through the center of the inscribed circle and thus are perpendicular bisectors to the sides of the small triangle inside. The distance from the center of the circle to the sides is equal to the radius of the circle. Believe me, understanding this makes geometry and trigonometry so much more simple. May the wonders of symmetry never cease!